01 / Financial Modelling
A model your board will defend.
We build the spreadsheet architecture and the board narrative — the model that underwrites the decision, and the deck that wins the room.
A · The Model
Excel, engineered.
Driver-based architecture. Auditable formulas. Scenario logic that survives a CFO's red pen. We treat the workbook as infrastructure — not a draft.
wolfsted-saas-financial-model.xlsx — ExcelWolfsted Advisory · v0.1
FileHomeInsertPage LayoutFormulasDataReviewView
D15fx=D14+SUMPRODUCT(Assumptions!$D$19:$D$26, Drivers!D$8:D$15)
| MRR Bridge ($ / mo) | Jan-26 | Feb-26 | Mar-26 | Apr-26 | May-26 | Jun-26 |
|---|---|---|---|---|---|---|
| Beginning MRR | 250,000 | 269,250 | 289,136 | 309,678 | 330,896 | 352,809 |
| (+) New MRR | 18,000 | 18,540 | 19,096 | 19,669 | 20,259 | 20,867 |
| (+) Expansion MRR | 5,000 | 5,385 | 5,783 | 6,194 | 6,618 | 7,056 |
| (–) Contraction MRR | (1,250) | (1,346) | (1,446) | (1,548) | (1,654) | (1,764) |
| (–) Churned MRR | (2,500) | (2,693) | (2,891) | (3,097) | (3,309) | (3,528) |
| Net New MRR | 19,250 | 19,886 | 20,542 | 21,217 | 21,914 | 22,631 |
| Ending MRR | 269,250 | 289,136 | 309,678 | 330,896 | 352,809 | 375,440 |
| ARR ($ / yr) | 3.23m | 3.47m | 3.72m | 3.97m | 4.23m | 4.51m |
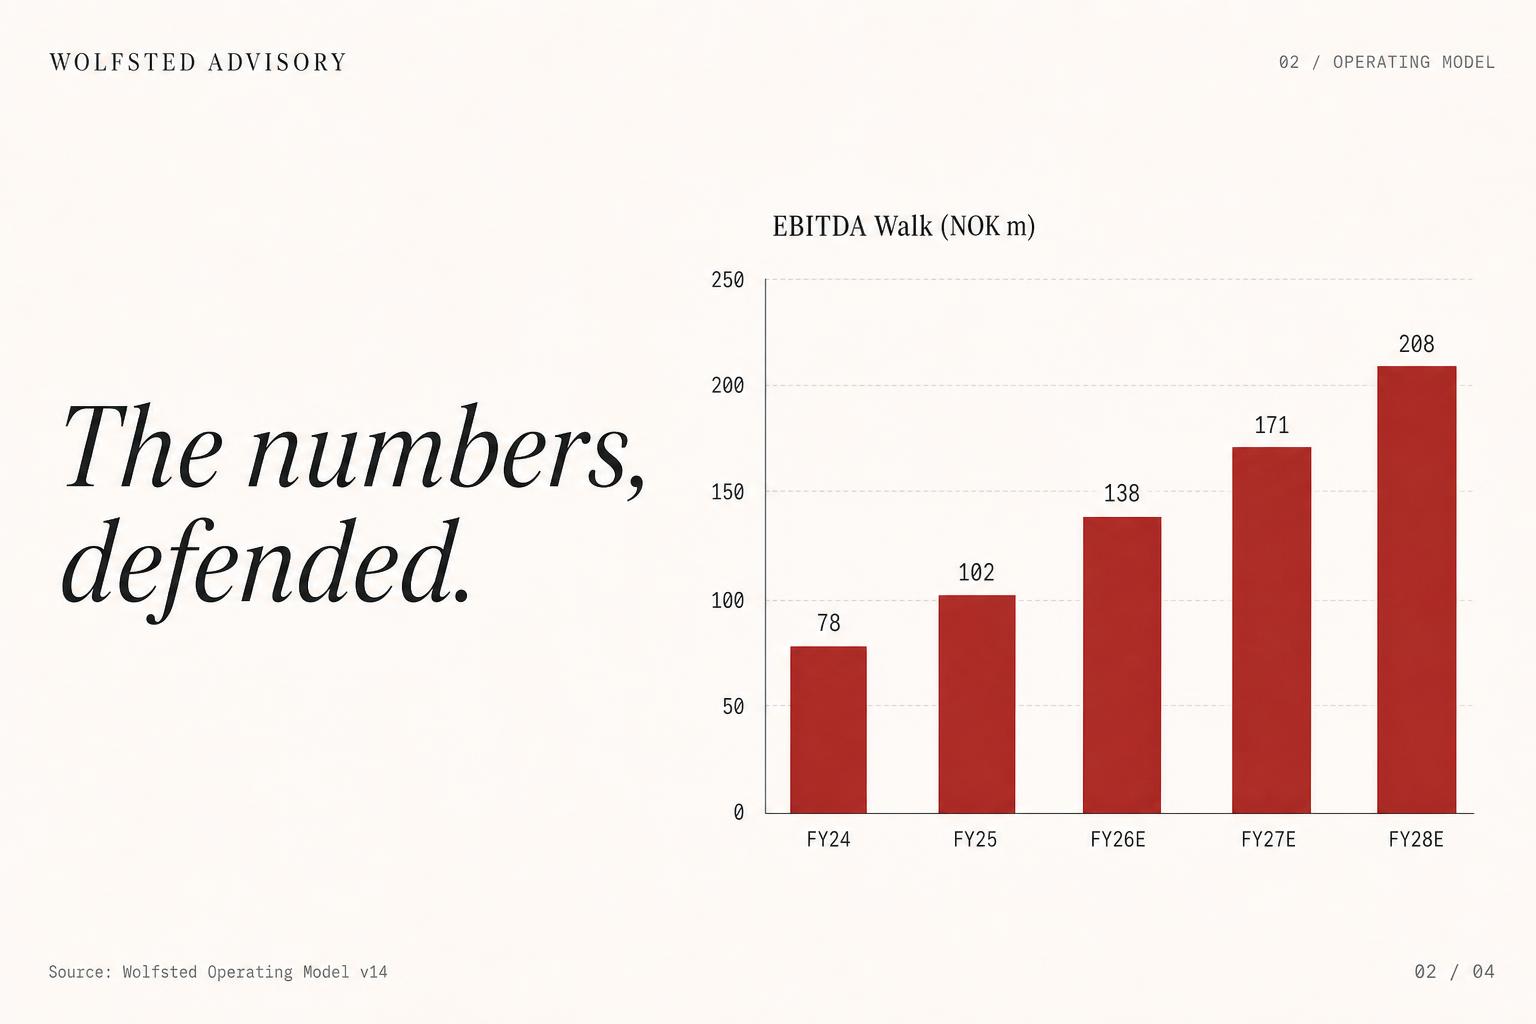
Chart_1 · Ending MRR — Months 1–6 ($k)
Ready · 13 sheets · Calculation: AutomaticΣ Avg 312,535 · Count 36 · Sum 1,875,209
Download Template .xlsx →235 KB · 13 sheets · Free
B · The Narrative
The deck the board funds.
The numbers translated into a single, defensible story. Each slide earns its place. No filler, no decoration — just the case, structured.

Continue